
Famed short-seller Jim Chanos, who was one of the earliest people to call out the fraudulent accounting in mega scams like Enron and Wirecard, termed the current period as the ‘golden age of fraud.’ In his view, a combination of easy money, weak regulatory oversights and unprecedented speculative frenzy with focus on short-term gains rather than long-term value have created a perfect platform for Ponzi schemes.
As far as Indian investors are concerned, focus now is on risks of frauds in the system after the Gensol Engineering fiasco that unravelled last week. After the allegations of fund diversion, promoters of Gensol, the Jaggi brothers, were barred from the securities market by SEBI. The stock continued its free fall and is down 90 per cent from its 52-week high.
Investor attention is now back to how one can detect accounting frauds. In the case of Gensol, though with the benefit of hindsight, it is easy to identify the red flags now, it is important to have a structure and a method to your analysis to spot the potential risks beforehand and stay safe with your hard-earned money.
In our bl. portfolio edition dated March 2, 2025, we had explained how the Beneish M-score helps identify companies fudging their numbers. While not without limitations and prone to occasional false signals, this tool remains highly useful for guiding investment decisions, especially in times of uncertainty. Its effectiveness as a screening mechanism is well-recognized. For example, students at Cornell University identified Enron as an accounting manipulator in 1998, three years before the giant scam unravelled and the company filed for bankruptcy.
So, we tested this out to see if investors could have applied this to Gensol and stayed away from the company before the shenanigans unfolded. The result we got was a resounding Yes!
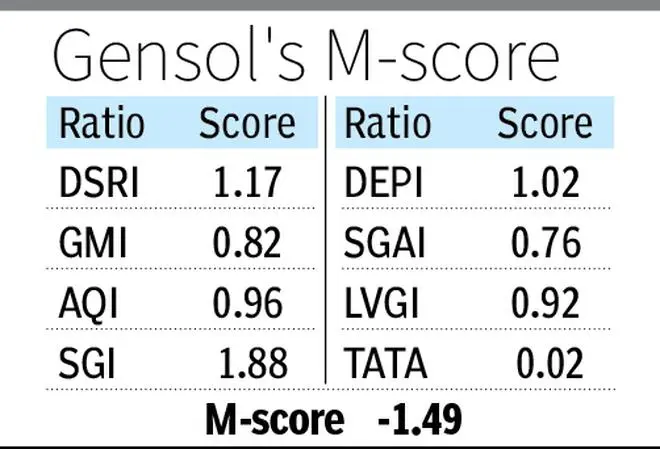
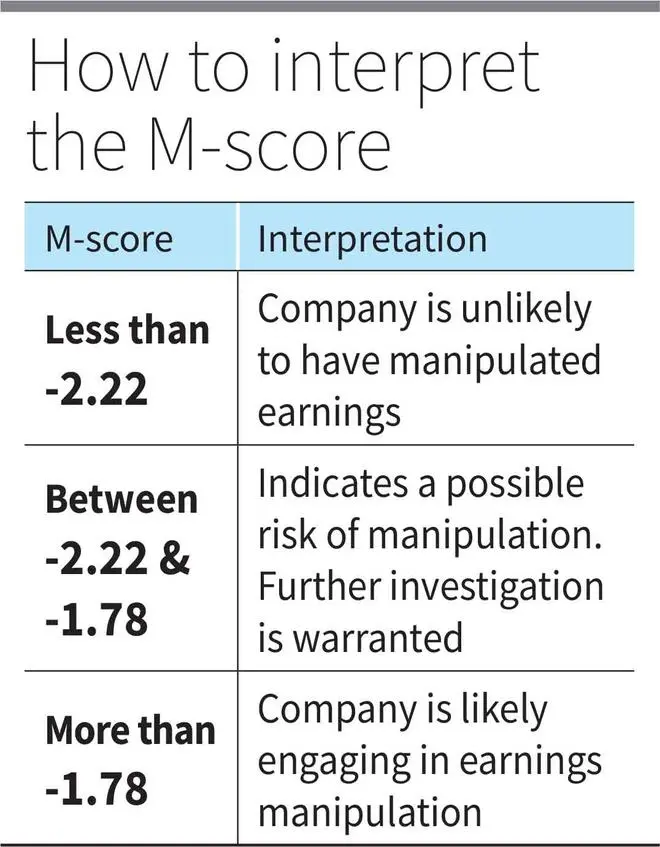
As per this tool, if the M-score is greater than -1.78, it means that a company is likely engaged in manipulation of its earnings. And Gensol scored -1.49 here. We have used Gensol’s latest available information (Q3 FY25 or Q2 FY25, as appropriate). Applying this would have made investors dig further or exit the stock before the blow-up.
Here is a recap of the score and how Gensol fared.
M-score and Gensol Engineering
The M-score methodology was devised in a research paper by Messod D. Beneish, an accounting professor at Kelley School of Business, Indiana University. He profiled a sample of companies that had engaged in earnings manipulations and studied their distinguishing characteristics. He then arrived at an equation/ formula that establishes a relation between certain accounting ratios and the probability of earnings manipulation.
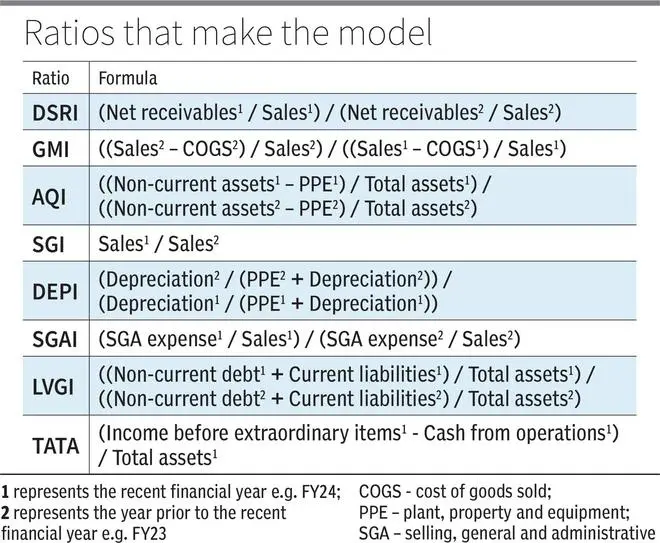
M-score = -4.84 + 0.92 DSRI + 0.528 GMI + 0.404 AQI + 0.892 SGI + 0.115 DEPI – 0.172 SGAI – 0.327 LVGI + 4.679 TATA
THE BREAKDOWN
DSRI
Gensol’s Days Sales in Receivables Index (DSRI) was 1.17, indicating that while the revenue increased, it wasn’t converted to cash at the same pace, resulting in increased receivables. Receivable days increased from 49 days in FY23 to 57 days in FY24 meaning a good chunk of revenue booked in FY24 was still stuck as receivables.
Companies might go lax on credit policy to inflate sales figures or even book fictitious sales, delaying cash flow and affecting liquidity and a ratio over 1 suggests sales could be artificially boosted. And here, the consequence of slower cash conversion was also observed in the operating cashflows of the company, which will be discussed under the TATA index.
GMI
Gensol being an EPC player, the Gross Margin Index (GMI) doesn’t hold much relevance. But reading it as it is, the company’s GMI score was 0.82, meaning there wasn’t pressure on gross margins even when sales doubled in the last 12 months.
AQI
Here is where Gensol failing to convert loans availed from IREDA and PFC for buying electric vehicles (EVs) into property, plant and equipment (PPE), gets flagged.
Notably, Gensol corrected a classification with respect to leases, during Q2 FY25, and recognised the existing contracts as finance lease. This essentially moved out the EV fleet leased to its ride-hailing business (BluSmart) from Gensol’s PPE to its financial assets (non-current). Making a comparable adjustment for the same, AQI stood at 0.96, missing the trigger (more than 1 indicates manipulation) just by a whisker.
Nevertheless, with the benefit of hindsight, capital advances still pending as advances for more than 12 months and increase in loans outstanding from related parties, not to mention the slew of loans given and received (to and fro) during the last two fiscal years, could be identified as smoking guns.
SGI
Gensol showed exponential growth in revenue since FY20, with CAGR growth until FY24 at 85 per cent, explaining a high Sales Growth Index (SGI) of 1.88 times. And with an orderbook of around ₹7,000 crore as of Q3 FY25, the company was projected to continue the exponential growth path. Its revenue, EBITDA and PAT recorded during 9M FY25 had already surpassed its FY24 numbers.
Pressure to deliver growth, per Beneish, can lead to unethical accounting practices, including earnings manipulation and in this case, it appears it did.
DEPI
While the Depreciation Index (DEPI) is 1.02 for Gensol, the company moved a chunk of its PPE (which was commercial vehicles) to other financial assets (non-current) during Q2 FY25.
Companies could manipulate such estimates to bring down the depreciation charge, thereby propping up the accounting profit. And here, the reclassification limited the interpretation here and is inconclusive.
SGAI
Gensol’s sales, general and administrative expenses increased at just about half the pace, as of its sales, taking the Sales, General, Administration expenses Index (SGAI) to 0.76, suggesting manipulation. And in money terms, it is more questionable. Revenue earned during the last 12 months was at ₹1,385 crore, up 88 per cent year on year from ₹735 crore, against SGA expenses at just ₹123 crore, up 42 per cent from ₹87 crore.
LVGI
While manipulators choose equity over debt to raise funds, to avoid inviting scrutiny from lenders and credit rating agencies, interestingly, Gensol chose debt over equity until FY24 and its Leverage Index (LVGI) was at 0.92 time, just below the alarming 1 time.
The size of the balance sheet went up 1.2x, by ₹1,262 crore to ₹2,327 crore as of March 2024 from March 2023. While equity contributed to just 8 per cent of this, fresh debt availed from financial institutions during FY24, in particular, added ₹873 crore (roughly 70 per cent).
Though equity infusion of around ₹220 crore was made after March 2024, the company defaulted for the first time in servicing its debt on December 31, 2024. What followed was a series of defaults, which was kept under the sheets with falsified documents submitted to credit rating agencies showing a clean track record, as noted by ICRA in its credit report where it downgraded Gensol’s credit rating.
TATA
Total Accruals to Total Assets (TATA) calculates the difference between a company’s accounting profit and operating cashflows, divided by total assets. The ability to convert accounting profits to cash profits reflects the true quality of earnings. That is why even in calculation of intrinsic value, future cash profits are discounted. This ratio, weighted at 4.679, is crucial.
Gensol, with ballooning working capital, easily failed this test with negative operating cashflows in FY24 which partially offset the positive cash flows during H1 FY25 to drag the cash profits well below the accounting profits reported.
The company reported negative operating cashflows in three out of the last five fiscal years, which also did not help the case.
All things considered, it ultimately comes to ‘investor beware’. Hence, running screeners like the M-score should not be a one-time check, but rather a periodic review.
Published on April 19, 2025
Anurag Dhole is a seasoned journalist and content writer with a passion for delivering timely, accurate, and engaging stories. With over 8 years of experience in digital media, she covers a wide range of topics—from breaking news and politics to business insights and cultural trends. Jane's writing style blends clarity with depth, aiming to inform and inspire readers in a fast-paced media landscape. When she’s not chasing stories, she’s likely reading investigative features or exploring local cafés for her next writing spot.
- ANURAG DHOLEhttps://indiatadkha.com/author/bitlancetechhubgmail-com/

- ANURAG DHOLEhttps://indiatadkha.com/author/bitlancetechhubgmail-com/
- ANURAG DHOLEhttps://indiatadkha.com/author/bitlancetechhubgmail-com/
- ANURAG DHOLEhttps://indiatadkha.com/author/bitlancetechhubgmail-com/