Silver, the poor man’s gold, has been in a strong rise since last year. After a lull in 2022 and 2023, silver prices surged 21 per cent in 2024. The price, currently around $33, is up about 14 per cent so far this year. Safe-haven investment demand on the back of the geo-political tensions, strong macroeconomic conditions boosting the industrial demand supported the price rise. The beginning of the interest rate cuts in the US also aided silver.
However, compared with gold, silver has been underperforming. The yellow metal was up 27 per cent in 2024 and has surged 265 per cent so far this year.
Will silver manage to end in green in 20265 for the third consecutive year? What is the outlook and where are the silver prices headed from here? Here is an analysis.
Demand and supply scenario
Silver ended 2024 with a deficit of 4,633 tonnes despite a slight dip in demand. This has been the fourth consecutive year of deficit. The total supply in 2024 increased 1.7 per cent to 31,574 tonnes. The demand, on the other hand, stood at 36,207 tonnes, down from 37,276 tonnes in the previous year, according to the data from Metal Focus. The drop was largely due to the weak demand in the physical investment and silverwares. The demand for Coins & Net Bar slumped 22 per cent last year to 5,939 tonnes. Silverwares demand fell 2 per cent to 1,684 tonnes.
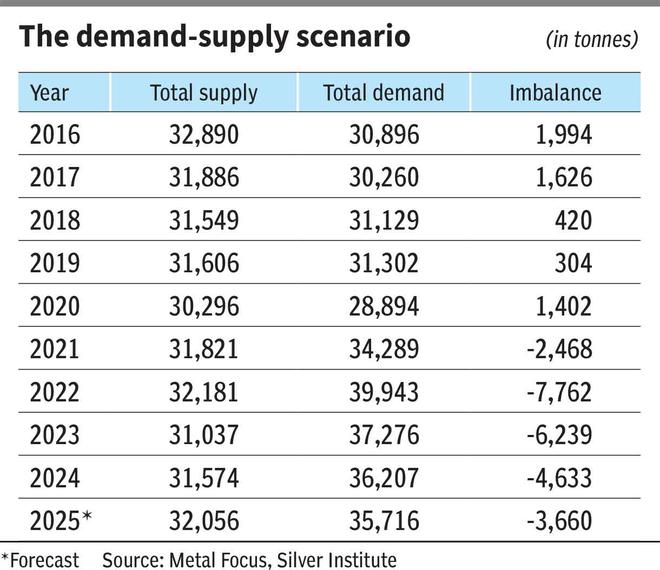
According to the Metal Focus’ World Silver Survey 2025, produced for the Silver Institute, the market will end 2025 also in a deficit for the fifth consecutive year. The supply is projected to increase 1.5 per cent to 32,056 tonnes in 2025. A 2 per cent increase in total mine production majorly from Mexico is likely to contribute for the higher supply this year.
On the other hand, the demand is likely to stand at 35,716 tonnes, down about 1.4 per cent compared with 2024. That will leave the market with a deficit of 3,660 tonnes this year. The demand for photovoltaics is expected to dip about a per cent to 6,086 tonnes on the back of thrifting, which was the major reason for the dip in demand in 2024. Thrifting means purchasing used goods instead of going for a new one. The jewelry and silverware demand are expected to fall sharply by 6 per cent and 15 per cent respectively. However, the projected 7 per cent surge in coin and bars demand is expected to offset the weakness in other categories.
Budget cut
As of now, there is no tariff imposed on silver. However, there has been a proposal to cut about $15 billion from the budget allocation in the US in the renewable energy and electric vehicle segments. Silver being an important component in these segments, the demand might slow down if budget cuts are implemented.
However, looking at the numbers, the impact of the budget cuts in the US on the silver market could be minimal. This is because the US contributes only about an average of 20 per cent to silver’s total industrial demand. East Asian countries contribute the most of over 50 per cent to the industrial demand. China alone contributes about an average of 28 per cent.
The photovoltaics, a major component used in solar panel, contributes about 22 per cent of the total global industrial demand. The rest comes from other industries. So, the budget cuts in the US on the renewables will have minimum impact on silver price.
Price impact
Overall, a fifth consecutive year of deficit in the silver market is likely to keep the prices higher. So, any major fall is unlikely. That leaves the chances high for silver price to end the year higher for the third consecutive year.
However, the pace of price rise could be slower considering the slight dip in demand. A possible slowdown in the global trade on the back of tariffs can also weigh on the pace of price rise in silver.
Now that the fundamental factors are looking supportive for silver, here we look at the charts to see where the price is headed based on technical analysis.
Silver: Technical outlook
The trend is up, and the prices have risen steadily since September 2022. From a low of about $17.5 per ounce (September 2022), silver price has surged about 89 per cent to the current level of $33. Although the pace of rise has slowed down, the trend continues to remain up.

Short-term supports are at $31.5 and $29.70. Below this, $28-27.50 is the lower support. The chances are high for the silver price to sustain above $29.70 itself. However, if it declines below $29.70, the maximum downside may be limited to $27.50. A fall beyond $27.50 looks unlikely from a long-term perspective.
Immediate resistance is around $35. A break above it can trigger a fresh rally to $41-42. If this rally happens at the same pace as of now, then $41-42 can be reached some time in the second half of 2026.
Silver has to fall below $27.50 to prove this bullish view wrong. In that case, a fall to $24 and lower levels can be seen.
Cross-market study
In order to verify the bullish view of the silver mentioned above, we are here doing a cross-market study. We take three components – Copper, CRB Commodity index and the MSCI World Industrials index, which have a very strong directional correlation with silver. We use technical analysis as a tool to forecast the copper price, CRB Commodity index and the MSCI World Industrials index. Then, using the concept of ratio chart analysis, we project where the silver price can go. Before we dive into the analysis here is a brief of what ratio chart analysis is.
Ratio charts
Take two variables and calculate the ratio between them. Plotting a series of this ratio in a chart will give us the ratio chart. For example, consider copper and silver. First, we calculate the copper/silver ratio by dividing copper price by that of silver. Taking the historical daily closing price of both copper and silver, calculating the ratio for each day and plotting them as a line graph will give us the daily chart of copper/silver ratio.
Now, how does this help us interpret the silver price? It involves three steps. First, make a forecast using technical analysis to see where the copper price is headed. Assume that your forecast gives you a price target of A for copper. Second, from the ratio chart made, do a forecast to see where the copper/silver ratio is headed. Keep this forecast target as B. Now, dividing A (copper price forecast) by B (ratio forecast) will give us the projection for silver price.
While gold/silver ratio is widely used metric globally, we have not mentioned that in our analysis here because the charts did not give us a clear picture.
Silver and copper
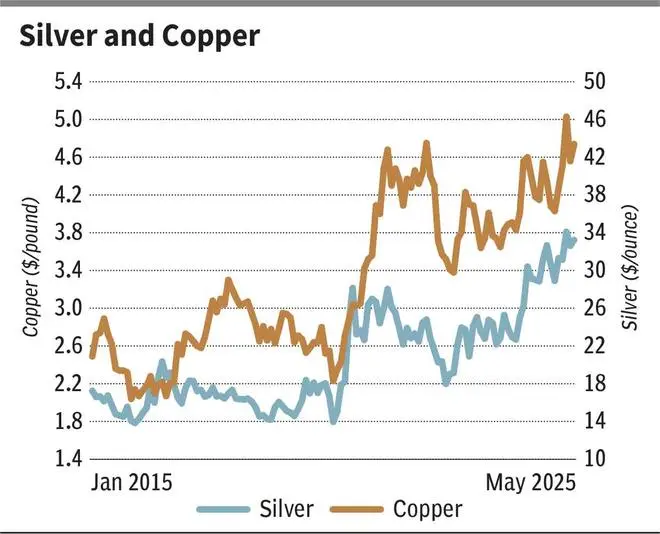
Historically, copper and silver prices have had a very strong directional correlation. Copper prices are at $4.68 per pound. Strong supports are there at $4.5 and $4.3. The chances are high for copper price to stay above $4.5 itself. Resistance is around $5.2.
The outlook is bullish. Copper can break $5.2 in the coming months. Such a break can take copper price up to $5.9-6 initially over the next one year. An eventual break above $6 can clear the way for the next targets of $6.3-6.5 from a much long-term perspective, say over the next couple of years.
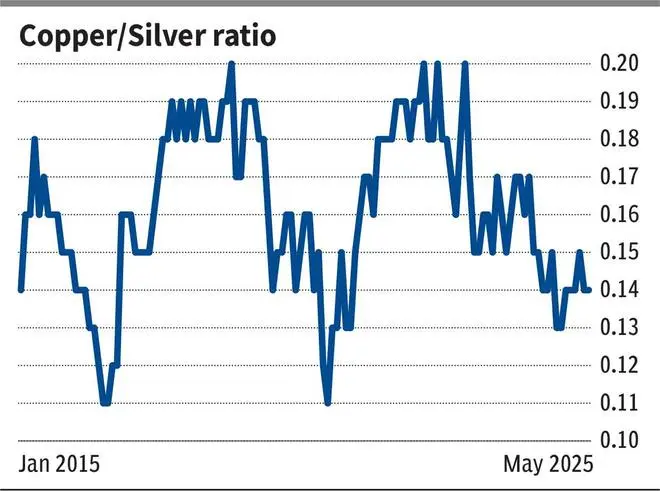
The copper/silver ratio (0.142) looks bearish for a fall to 0.10, which can happen by this year-end. After that, the ratio can rise back to 0.14 again by the second quarter next year.
So, copper at $6 and the ratio at 0.14 in the next one year gives us a target of $42.85 for silver.
Silver and CRB index
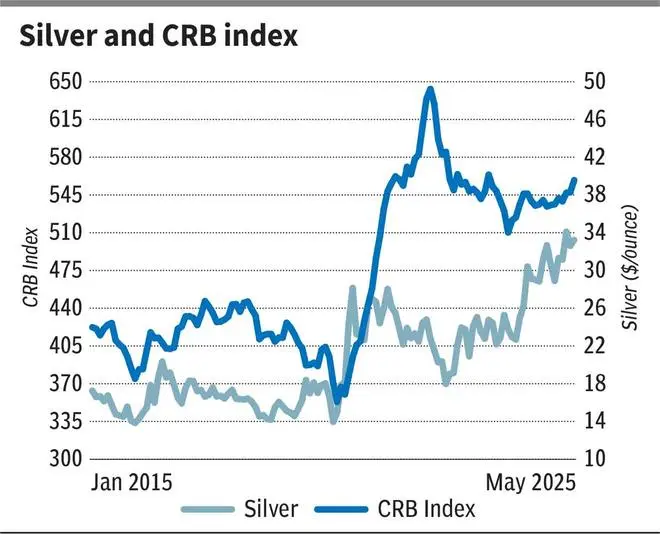
CRB (Commodity Research Bureau) Commodity index is one of the benchmarks for the global commodity markets. It comprises 19 commodities that include gold, silver and copper. Industrial and precious metals form 20 per cent of the index. As seen from the chart, the index has a strong directional correlation with silver.
The CRB Commodity Index (555) peaked around 643 in April 2022 and has been in a strong downtrend. But the recent price action indicates that the trend is getting reversed. The outlook is bullish. Support is in the 550-530 region. The CRB Commodity index can rise to 650 over the next one year.
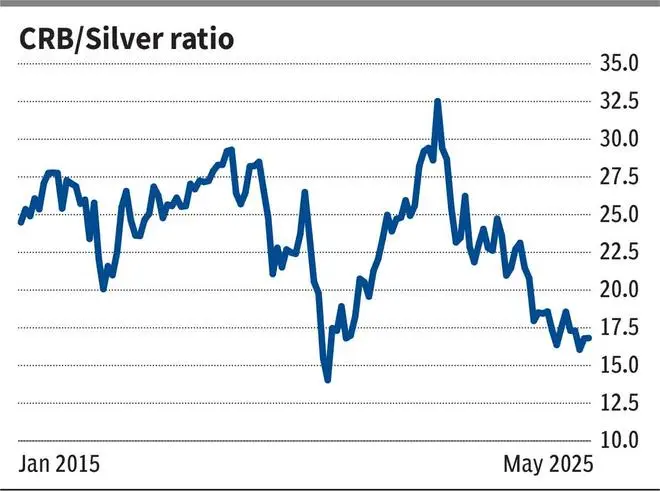
The CRB index/silver ratio (16.82) is currently stuck between 15 and 20. The trend is down. The ratio can break 15 and fall to 12-10 initially, may be by this year-end. After this fall, the ratio can rise back to 15 again in the first half of next year.
The rise to 650 on the index and the ratio at 15 gives a resultant value of $43.33 for silver.
Silver and MSCI World Industrials Index
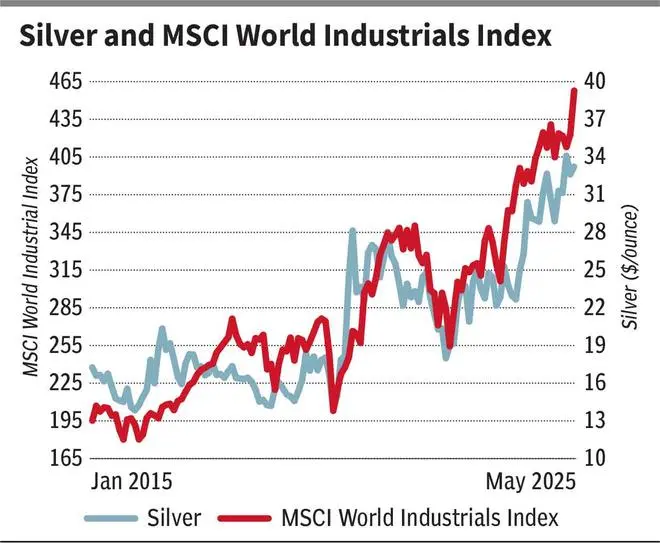
The MSCI World Industrials Index constitutes stocks of 255 companies from the developed markets. The stocks are from the industrial sectors of countries such as the US, Japan, France, Germany, the UK and others.
The index fell to a low of 380 in the first week of April immediately after the tariff announcement by the US President Donald Trump. But thereafter, it has recovered very sharply and has risen to the current level of 456. This rise has taken the index well above a key resistance level of 440. An immediate resistance is at 460. A corrective dip to 440 can be seen in the short term. The level of 440 will act as a good support, going forward.
As long as the index stays above 440, the outlook is bullish to see 500 on the upside.
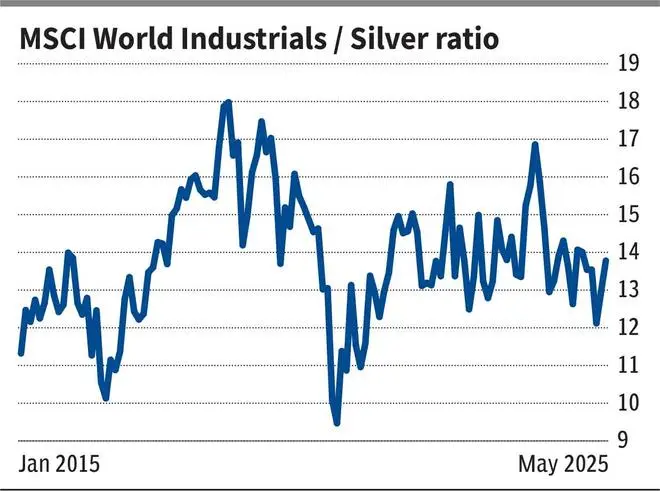
The MSCI World Industrials /silver ratio (13.5) is stuck between 12 and 17 for more than three years. This sideways range can continue to remain intact for now. But the broader bias is negative for the index to break 12 and fall to 10-9 initially. After this fall, it can rise back again to 12.
The rise to 500 on the index and the ratio at 12 will give us a value of $41.67 for silver.
Take away
The above study indicates that the ratio in all the three cases is likely to fall first and then rise back again. A fall in the ratio means that silver can outperform initially. Thereafter, the rise in the ratio will indicate that silver will underperform. This means that the silver price can shoot up initially before settling around the level of $42-43.
Published on May 31, 2025
Anurag Dhole is a seasoned journalist and content writer with a passion for delivering timely, accurate, and engaging stories. With over 8 years of experience in digital media, she covers a wide range of topics—from breaking news and politics to business insights and cultural trends. Jane's writing style blends clarity with depth, aiming to inform and inspire readers in a fast-paced media landscape. When she’s not chasing stories, she’s likely reading investigative features or exploring local cafés for her next writing spot.
- ANURAG DHOLEhttps://indiatadkha.com/author/bitlancetechhubgmail-com/

- ANURAG DHOLEhttps://indiatadkha.com/author/bitlancetechhubgmail-com/
- ANURAG DHOLEhttps://indiatadkha.com/author/bitlancetechhubgmail-com/
- ANURAG DHOLEhttps://indiatadkha.com/author/bitlancetechhubgmail-com/